Overexpression of tPA causes upregulation of cytoprotective and pro-apoptotic adaptive responses
To discover methods for modulating the UPR in response to emphasize induced by overexpression of secretory proteins, we used the mannequin protein human tPA. Human tPA is a 70 kDa serine protease containing three main N-glycosylation websites and 17 disulfide bonds requiring complicated post-translational processing26. At present the one FDA-approved thrombolytic agent (alteplase) for the essential early therapy of acute ischemic strokes, tPA is used to deal with acute thromboembolisms27. Considerations concerning the potential results of the latest world scarcity of recombinant tPA have been not too long ago exacerbated by the pressing want for tPA provides to handle COVID-19-associated acute respiratory misery syndrome, indicating a urgent want to keep up ample financial provides of this emergency treatment28.
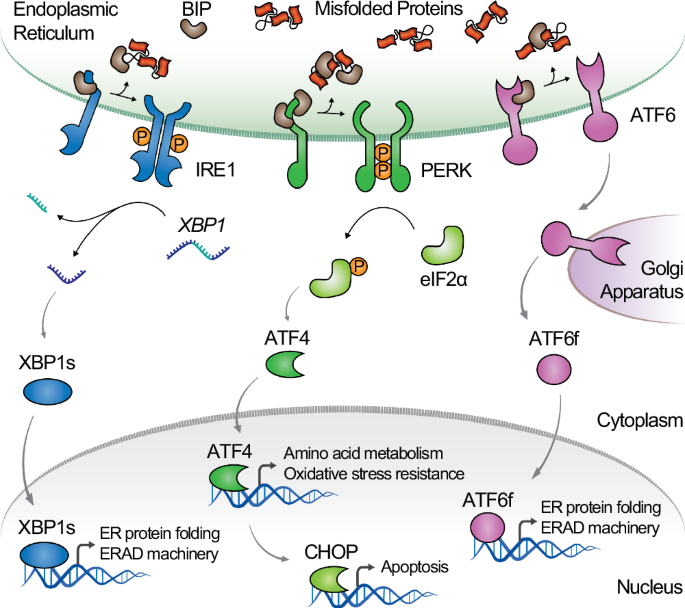
To guage the activation of the UPR and, extra particularly, UPR signaling pathways mediating stress attenuation and apoptosis, we profiled the expression of three UPR marker genes, ERdj4, EIF4, and CHOP, in cells engineered to specific tPA. ERdj4 is managed by the transcription issue XBP1s and has been validated as a reporter of the IRE1 pathway, offering a measurement of stress attenuation29. EIF4 and CHOP are managed by the transcription issue ATF4 and are generally monitored as reporters of the PERK pathway to quantify UPR-mediated translational management and apoptosis, respectively. Importantly, ERdj4 and EIF4 are particular targets of XBP1s and ATF4, respectively, and don’t reply to crosstalk between the UPR branches29. CHOP is a grasp regulator of UPR-induced apoptosis throughout extended ER stress and offers a particular readout of cytotoxicity related to recombinant protein overexpression30,31. To watch ERdj4, EIF4, and CHOP expression, we used a set of reporter cell traces beforehand developed to quantify gene exercise from the chromosomal context29. In these reporter cell traces, the expression of a UPR goal gene is linked to that of the inexperienced fluorescence protein (GFP) via an orthogonal genetic circuit that allows goal gene profiling with excessive sensitivity and dynamic decision of UPR induction (Fig. 2a)29. Particularly, the expression of the UPR goal gene is linked to that of a transcriptional regulator (the tetracycline-dependent transactivator, tTA) via an inner ribose entry web site (IRES) to keep up a relentless expression ratio between the UPR goal gene and tTA32,33. GFP expression is activated by tTA, mediating sign output amplification. GFP expression can be negatively regulated transcriptionally by the erythromycin-dependent Krüppel-associated field repressor (EKRAB) and post-translationally by way of proteasomal degradation mediated by the NanoDeg34. EKRAB and the NanoDeg are repressed by tTA, and thus activated below basal circumstances to mediate GFP repression and fast GFP protein depletion, respectively, in the end enhancing the output dynamic vary and the dynamic decision of the goal gene expression. To guage the impact of tPA expression on ERdj4, EIF4, and CHOP exercise, we produced lentiviral particles expressing the gene encoding tPA (hPLAT) linked to the gene encoding the near-infrared fluorescent protein (iRFP) via an IRES. Lentiviral transductions had been carried out by various the variety of viral particles anticipated to have an effect on transgene supply and, in the end, tPA expression ranges (low, medium, and excessive). On condition that the chance of an infection may be estimated utilizing a Poisson distribution, transductions had been carried out utilizing a multiplicity of an infection (MOI) anticipated to attenuate the chance of cells with a number of infections (MOI = 0.35, low), maximize the chance of single infections (MOI = 1, mid), and maximize the chance of a number of infections (MOI = 35, excessive). To confirm tPA expression ranges and assess the correlation between hPLAT expression and tPA protein manufacturing, we transduced the UPR reporters with viral particles encoding hPLAT and iRFP utilizing totally different MOIs. We monitored the iRFP sign as a sign of transgene expression ranges and tPA exercise as a sign of practical tPA manufacturing. The iRFP imply fluorescence of transduced (iRFP-positive) cells was measured utilizing move cytometry, and tPA exercise was monitored by quantifying the cleavage of a fluorogenic substrate as reported35,36. We noticed a correlation between the iRFP sign and transgene supply. Particularly, the iRFP imply fluorescence elevated by 32% and 60% after 8 days of transduction with medium and excessive MOI in comparison with low MOI (Fig. 2b). We noticed a correlation between iRFP and hPLAT mRNA ranges, the iRFP sign, and transduction circumstances (i.e., MOI), indicating that transgene expression is dependent upon the transgene supply (Supplementary Fig. 1a-c). Apparently, cells transduced with a medium MOI displayed an 84% enhance in tPA exercise ranges in comparison with cells transduced with a low MOI (Fig. 2c). Nevertheless, tPA exercise ranges didn’t enhance additional upon cell transduction with a excessive MOI. These outcomes recommend that growing transgene supply ends in a rise in hPLAT expression however doesn’t parallel the anticipated enhance in practical tPA manufacturing, as beforehand reported7,10.

a Schematic of the UPR gene sign amplifier. IRES-tTA is built-in 3’ of the goal gene to hyperlink tTA expression to the UPR goal. GFP is managed by a hybrid promoter comprising the tTA-specific operator (TRE), the minimal CMV promoter, and the EKRAB-specific operator (ETR). EKRAB and the NanoDeg are repressed by tTA (CMV-TO). The NanoDeg mediates GFP degradation. b iRFP sign of HEK293 cells with the gene sign amplifier described in a for monitoring the ERdj4 gene, transduced with virus expressing tPA and iRFP at MOIs of 0.35 (low), 1 (mid), and 35 (excessive), eight days post-transduction. (c) tPA exercise of cells transduced as in b. d–f Imply iRFP fluorescence of iRFP-positive HEK293 cells with the gene sign amplifier linked to ERdj4 (d), EIF4 (e), and CHOP (f) and transduced with virus expressing tPA and iRFP at MOIs of 0.35 (low), 1 (mid), and 35 (excessive). g–i UPR induction index of HEK293 cells engineered with the gene sign amplifier linked to ERdj4 (g), EIF4 (h), and CHOP (i) and transduced with virus expressing tPA and iRFP at MOIs of 0.35 (low), 1 (mid), and 35 (excessive). The UPR induction index was obtained by multiplying the imply GFP fluorescence by the fraction of cells expressing GFP. j Consultant move cytometry analyses of HEK293 cells engineered with the gene sign amplifier linked to EIF4 transduced with virus expressing tPA and iRFP at an MOI of 35 (excessive) depicting gating boundaries used to outline the “low” and “excessive” GFP subpopulations inside iRFP-positive cells. ok–m iRFP sign of HEK293 cells engineered with the gene sign amplifier linked to ERdj4 (ok), EIF4 (l), and CHOP (m) and transduced with virus expressing tPA and iRFP at an MOI of 35 (excessive) 4 days post-transduction. The “low” and “excessive” GFP subpopulations had been outlined as proven in j. Information are reported as imply ± s.e.m. (n = 3 organic replicates). P-values had been calculated utilizing an unpaired Scholar’s t-test with a two-tailed evaluation. Supply information are supplied as a Supply Information file.
To watch ERdj4, EIF4, and CHOP exercise upon expression of tPA, ERdj4, EIF4, and CHOP reporter cells had been transduced with lentiviral particles expressing tPA/iRFP at totally different MOIs and analyzed by move cytometry. Stream cytometry measurements verified the correlation between the iRFP sign and the transduction MOI over time (Fig. Second-f), suggesting low, intermediate, and excessive ranges of tPA expression. To guage the expression of UPR goal genes in cells expressing tPA, we quantified the GFP sign in iRFP-positive cells as a operate of time. Particularly, we evaluated the UPR induction index of iRFP-positive cells, which accounts for the fraction of the cell inhabitants with UPR goal gene upregulation and the extent of UPR goal gene expression. We noticed a correlation between ERdj4 expression and transgene supply. ERdj4 induction was discovered to peak after 4-6 days of transduction and show a 2- and 6-fold enhance in cells transduced with medium and excessive MOI, respectively, in comparison with cells transduced with a low MOI (Fig. 2g), indicating greater activation of the IRE1 pathway in cells with greater transgene expression. After extended tPA expression, the GFP sign of ERdj4 reporter cells transduced with a low MOI returned to ranges corresponding to these noticed at preliminary occasions (examine 10 days to 2 days post-transduction). The GFP sign of cells transduced with medium or excessive MOIs was considerably greater than the corresponding measurements at preliminary transduction occasions, suggesting a protracted upregulation of the IRE1 pathway at greater ranges of tPA expression. The EIF4 reporter cells offered the same habits: EIF4 expression peaked 4 days post-transduction in an MOI-dependent vogue (Fig. 2h), suggesting that the activation of the PERK pathway is dependent upon the tPA expression ranges and that it’s sustained at excessive tPA expression ranges. Measurements of CHOP reporter cells revealed minimal CHOP expression in cells transduced with low or medium MOIs (Fig. 2i), suggesting low UPR-induced apoptosis. Transductions with excessive MOI prompted a rise in GFP sign that peaked 6 days post-transduction, leading to a 7-fold enhance within the UPR induction index in comparison with cells transduced with a low MOI, suggesting activation of UPR-mediated apoptosis in response to excessive ranges of tPA expression. In abstract, these outcomes recommend that the UPR is induced in cells expressing tPA to an extent that is dependent upon tPA expression stage. Apparently, we discovered the fraction of cells displaying UPR induction to lower with the time of transgene expression (Supplementary Fig. 2a-c), suggesting that the cell inhabitants presenting UPR activation is heterogenous and {that a} fraction of this inhabitants recovers from proteotoxic stress. We additionally discovered the fraction of cells displaying UPR induction to keep up fixed expression ranges of the UPR marker gene monitored on this examine (Supplementary Fig. Second-f).
To additional consider the correlation between tPA expression and UPR induction, we quantified transgene expression ranges in subpopulations of cells with totally different extents of UPR induction. To this finish, we quantified the iRFP imply fluorescence of subpopulations of the UPR reporter cells transduced with a excessive MOI 4 days post-transduction. Transduced (iRFP-positive) cells had been gated to pick GFP-positive cells (Fig. 2j). Excessive and low GFP indicators had been outlined by gating subpopulations similar to the bottom 20% and highest 20% of the GFP-positive distribution. We noticed a correlation between transgene expression, evaluated by quantifying the iRFP sign, and UPR induction, evaluated by quantifying the GFP sign, suggesting that the extent of tPA expression impacts the upregulation of the UPR goal genes ERdj4, EIF4, and CHOP. Particularly, we discovered the “excessive GFP” subpopulations of the ERdj4, EIF4, and CHOP reporter cell traces to current, respectively, 27%, 39%, and 27% greater transgene expression in comparison with the corresponding “low GFP” subpopulations (Fig. 2k-m).
A mobile sensor for detection of the IRE1 pathway activation
To engineer host cell traces with enhanced tPA productiveness, we sought to modulate the UPR to enhance the attenuation of proteotoxic stress. To this finish, we explored feedback-controlled methods for modulating the expression of key URP goal genes in response to the detection of ER stress. Such an strategy would allow fluctuations in folding necessities to be addressed and the UPR managed on the single-cell stage, thereby addressing inhabitants heterogeneities. To develop sense-and-response methods that modulate the UPR upon detecting ER stress, we first generated a mobile sensor of IRE1, a grasp regulator of the UPR, activated upon accumulation of misfolded proteins within the ER lumen. Activated IRE1 mediates the non-conventional splicing of XBP1 mRNA, ensuing within the translation of an energetic transcription issue (XBP1s) that controls the expression of a community of genes, together with ERdj4. To create an IRE1 sensor, we engineered HEK293 cells to hyperlink XBP1 splicing to the expression of the grasp regulator, tTA. Such a technique permits interfacing the IRE1 pathway with user-controlled orthogonal genetic networks designed to reply to tTA management. Particularly, we built-in a cassette containing the tTA gene preceded by the coding sequence of a 2 A self-cleaving peptide (P2A) from porcine teschovirus downstream of the XBP1 ER stress-specific intron utilizing CRISPR-Cas9 mediated enhancing (Fig. 3a)37. Upon activation of IRE1, splicing of a 26 bp intron from the XBP1_P2A_tTA mRNA results in a frameshift and ends in the interpretation of XBP1s fused to tTA via the two A peptide38. Self-cleavage of the 2A peptide ends in equal expression ranges of XBP1s and tTA. The ensuing cells (HEK293/tTA) had been analyzed by genomic PCR to confirm the knock-in mutation on the desired goal web site (Supplementary Fig. 3a, b). To confirm that HEK293/tTA cells are engineered to hyperlink the expression of tTA to that of spliced XBP1, we evaluated tTA exercise upon induction of ER stress. HEK293/tTA cells had been transiently transfected with a plasmid encoding GFP below the management of the tetracycline-responsive aspect (TRE) promoter that responds to tTA activation. ER stress was induced utilizing tunicamycin, a canonical UPR inducer, which impacts glycoprotein processing39,40. Stream cytometry analyses of transfected cells handled with tunicamycin (1 μg/ml) revealed a 2-fold enhance in GFP fluorescence in comparison with untreated cells (Fig. 3b). The addition of the tTA inhibitor tetracycline (1 μg/ml) to cells handled with tunicamycin resulted in a 74% discount in GFP fluorescence, suggesting that the GFP sign induced by ER stress is mediated by tTA. Apparently, including tetracycline at a dose anticipated to mediate full inhibition of tTA resulted in a 50% lower within the GFP output in comparison with untreated cells (Fig. 3b), indicative of XBP1 splicing below resting circumstances, as beforehand reported41. To confirm that the mixing of tTA downstream of XBP1 doesn’t have an effect on the exercise of the IRE1 pathway, we monitored the mRNA ranges of spliced XBP1 and its downstream goal gene ERdj4 in HEK293 and HEK293/tTA cells induced with tunicamycin (1 μg/ml) for twenty-four hours by utilizing quantitative RT-PCR. HEK293/tTA and parental HEK293 cells handled with tunicamycin displayed comparable XBP1s and ERdj4 mRNA ranges (p > 0.1, Scholar’s t-test) (Supplementary Fig. 3c, d), indicating that chromosomal integration of tTA doesn’t have an effect on the native IRE1-XBP1s signaling.

a Schematic illustration of the IRE1 sensor (HEK293/tTA cells) constructed by integrating the P2A_tTA cassette downstream of the XBP1 splice web site within the genome of HEK293 cells. b GFP sign of HEK293/tTA cells transfected with a plasmid encoding GFP below the management of tTA, handled with tunicamycin (1 μg/mL) and tetracycline (1 μg/mL), and measured by move cytometry. Information are reported as imply ± s.e.m. (n = 3 organic replicates). P-values had been calculated utilizing an unpaired Scholar’s t-test with a two-tailed evaluation. Supply information are supplied as a Supply Information file.
Suggestions-regulated management of XBP1s expression amplifies XBP1s signaling
To generate a sense-and-response system that amplifies the cytoprotective impact of the UPR upon ER stress, we engineered the IRE1 sensor (HEK293/tTA cells) with a constructive suggestions loop leading to overexpression of the IRE1 pathway grasp regulator, XBP1s, upon detection of IRE1 activation. We built-in a cassette encoding spliced XBP1 (XBP1s) and a fluorescent reporter (iRFP) linked by an IRES and below the management of the TRE promoter into HEK293/tTA cells utilizing lentivirus transduction (Fig. 4a). Within the ensuing cells, the splicing of endogenous XBP1 and the expression of recombinant XBP1s are linked by tTA, which interfaces the XBP1s amplification loop with IRE1 activation. Transduced cells had been chosen and diluted to isolate single clones (HEK293/tTA_XBP1s). The ensuing monoclonal populations had been handled with tunicamycin (1 μg/ml, 48 hours), and iRFP fluorescence was measured utilizing move cytometry (Supplementary Fig. 4). Two consultant clones (HEK293/tTA_XBP1s clones #1 and #2) that current totally different extents of XBP1s self-amplification upon therapy with tunicamycin, as quantified by monitoring the iRFP fold change, had been chosen for additional research (Supplementary Fig. 4, blue bars). Remedy of HEK293/tTA_XBP1s #1 and #2 with tunicamycin (10 μg/ml, 48 hours) resulted in a 2.4- and seven.6-fold enhance in iRFP fluorescence, respectively, in comparison with untreated cells (Fig. 4b, c), which is indicative of the expression of the XBP1s_IRES_iRFP cassette in response to UPR induction. The addition of tetracycline (1 μg/ml) to tunicamycin-treated cells resulted in additional than 60% discount in iRFP fluorescence in each HEK293/tTA_XBP1s #1 and #2, suggesting that the iRFP sign induced by ER stress is mediated by tTA. As beforehand noticed within the parental HEK293/tTA cell line, the addition of tetracycline at a focus anticipated to mediate full inhibition of tTA resulted in a 24% and 39% lower within the iRFP fluorescence in HEK293/tTA_XBP1s #1 and #2 cells, respectively, in comparison with untreated cells, which is indicative of splicing of XBP1 at basal circumstances41.

a Schematic illustration of the sense-and-respond system for amplifying XBP1s expression in response to XBP1 splicing. The sense-and-respond system (HEK293/tTA_XBP1s cells) was constructed by integrating a cassette encoding XBP1s and iRFP linked by an IRES, below the management of tTA within the genome of the IRE1 sensor (HEK293/tTA cells). b, c iRFP sign of HEK293/tTA_XBP1s cells clones #1 (b) and #2 (c) handled with tunicamycin (10 μg/mL) and tetracycline (1 μg/mL) for 48 hours and measured by move cytometry. iRFP fold change values had been obtained by normalizing the iRFP fluorescence depth of handled cells to that of untreated cells. d, e Quantitative RT-PCR analyses of XBP1s (d) and ERdj4 (e) mRNA ranges of HEK293 and HEK293/tTA_XBP1s cells handled with tunicamycin (10 μg/mL). Relative mRNA expression ranges had been obtained by normalizing the mRNA expression ranges of handled cells to these of untreated cells. f MTS absorbance of HEK293 and HEK293/tTA_XBP1s cells handled with tunicamycin (10 μg/mL) relative to untreated cells. Information are reported as imply ± s.e.m. (n = 3 organic replicates). P values had been calculated utilizing an unpaired Scholar’s t-test with a two-tailed evaluation. Supply information are supplied as a Supply Information file.
To characterize the habits of the XBP1s sense-and-respond system upon ER stress, we monitored XBP1s mRNA ranges in HEK293/tTA_XBP1s cells induced with tunicamycin. HEK293/tTA_XBP1s #1 and #2 and parental HEK293 cells had been handled with tunicamycin (10 μg/ml), and the mRNA ranges of XBP1s had been measured utilizing quantitative RT-PCR. HEK293 cells induced with tunicamycin, used right here as a management, displayed a gradual enhance in XBP1s mRNA, from a 5-fold change after 12 hours of therapy to a 14-fold change after 48 hours of therapy in comparison with untreated cells (Fig. 4d). HEK293/tTA_XBP1s #1 cells displayed a 22-fold enhance in XBP1s mRNA ranges after 12 hours of therapy, which decreased by 78% after 36 hours and remained at fixed low ranges for the following 12 hours. HEK293/tTA_XBP1s #2 displayed a 35-fold enhance in XBP1s mRNA ranges after 12 hours of therapy, which peaked after 24 hours, reaching a 59-fold enhance, and decreased to ranges corresponding to these noticed in HEK293/tTA_XBP1s #1 after 48 hours. The dramatic enhance in XBP1s mRNA ranges of HEK293/tTA_XBP1s clones in comparison with parental HEK293 cells after 12-24 hours of tunicamycin therapy is indicative of self-amplification of XBP1s expression upon ER stress. This enhance in XBP1s expression correlates with the fold change in iRFP sign (Fig. 4b, c), confirming that XBP1s expression is dependent upon the suggestions amplification loop. Notably, the XBP1s mRNA ranges of each HEK293/tTA_XBP1s clones endure a extra dramatic lower than the XBP1s mRNA ranges of the parental HEK293 uncovered to the identical therapy (examine relative XBP1s mRNA ranges at 48 hours, Fig. 4d), suggesting a suggestions mechanism through which the XBP1s amplification loop results in attenuation of the stress response.
To additional characterize the XBP1s self-amplification response, we monitored the mRNA ranges of ERdj4, an XBP1s downstream goal, in HEK293/tTA_XBP1s cells induced with tunicamycin. HEK293 cells handled with tunicamycin (10 μg/ml) displayed a rise in ERdj4 mRNA ranges that reached a 6-fold change after 48 hours of therapy in comparison with untreated cells (Fig. 4e). HEK293/tTA_XBP1s #1 displayed a peak 5-fold enhance in ERdj4 mRNA ranges after 12 hours of therapy, which decreased by 51% after 36 hours and remained fixed for the following 12 hours. HEK293/tTA_XBP1s #2 displayed a 7-fold enhance in ERdj4 mRNA ranges after 24 hours of therapy, which decreased by 42% after 48 hours. Apparently, the extent of upregulation of XBP1s and ERdj4 expression within the HEK293/tTA_XBP1s clones correlates with the iRFP fold change, with the clone presenting a bigger amplification of XBP1s as quantified by the iRFP sign (#2) displaying a bigger enhance in XBP1s and ERdj4 mRNA ranges. The correlation between ERdj4 and XBP1s mRNA ranges within the HEK293/tTA_XBP1s clones means that the XBP1s self-amplification loop mediates the upregulation of ERdj4 noticed in these cells.
Given the beforehand reported cytoprotective results of IRE1 signaling and, significantly, XBP1s overexpression, we additionally evaluated the affect of the amplification loop on HEK293/tTA_XBP1s cell viability. HEK293/tTA_XBP1s #1 and #2 and parental HEK293 cells had been handled with tunicamycin (10 μg/ml, 48 hours), and cell viability was monitored utilizing the MTS assay. HEK293/tTA_XBP1s clones #1 and #2 displayed a 42% and 55% enhance in viability, respectively, in comparison with HEK293 cells (Fig. 4f). The upper cell viability within the HEK293/tTA_XBP1s clones subjected to ER stress than in parental cells signifies that amplifying the IRE1 response attenuates ER stress.
Suggestions-regulated silencing of CHOP response delays CHOP signaling and apoptosis
To generate a sense-and-response system that delays the activation of UPR-induced apoptosis, usually noticed upon sustained ER stress, we engineered the IRE1 sensor (HEK293/tTA cells) to manage a suggestions loop mediating CHOP silencing. We designed a brief hairpin RNA in opposition to CHOP (shCHOP) to mediate CHOP knockdown. To confirm that the expression of shCHOP results in CHOP silencing, we evaluated CHOP expression utilizing the CHOP reporter cell line beforehand developed to hyperlink the expression of CHOP to GFP manufacturing. CHOP reporter cells had been transiently transfected with a plasmid encoding shCHOP and handled with tunicamycin (10 μg/ml, 1 hour). Stream cytometry evaluation of cells transfected with shCHOP revealed a 69% lower in GFP fluorescence in comparison with cells transfected with a nontargeting management (Supplementary Fig. 5), indicating that shCHOP mediates knockdown of CHOP expression. To hyperlink the expression of shCHOP to activation of the IRE1 sensor, we generated an expression cassette containing shCHOP flanked by the genomic microRNA miR-30 and inserted inside the 3’UTR of iRFP below the management of the TRE promoter42,43,44,45,46. HEK293/tTA cells had been transduced with viral particles encoding the iRFP-shCHOP cassette anticipated to generate a tTA-inducible system expressing fixed ratios of shCHOP and iRFP (Fig. 5a). Within the ensuing cells, the splicing of endogenous XBP1 and the expression of shCHOP are linked by tTA, which interfaces IRE1 activation with CHOP silencing. Secure cell traces had been expanded and diluted to isolate monoclonal populations (HEK293/tTA_shCHOP). The ensuing monoclonal populations had been handled with tunicamycin (1 μg/ml, 48 hours), and the iRFP fluorescence was measured utilizing move cytometry (Supplementary Fig. 6). The monoclonal inhabitants presenting the very best fold change in iRFP fluorescence upon therapy with tunicamycin was chosen for additional research (Supplementary Fig. 6, inexperienced bar).

a Schematic illustration of the sense-and-respond system for silencing CHOP expression in response to XBP1 activation. The sense-and-respond system (HEK293/tTA_shCHOP cells) was constructed by integrating a cassette encoding iRFP adopted by the miR30-based anti-CHOP quick hairpin RNA (shCHOP) below the management of tTA into the genome of the IRE1 sensor (HEK293/tTA cells). b iRFP sign of HEK293/tTA_shCHOP cells handled with tunicamycin (10 μg/mL) and tetracycline (1 μg/mL) for 48 hours and measured by move cytometry. iRFP fold change values had been obtained by normalizing the iRFP fluorescence depth of handled cells to that of untreated cells. c Quantitative RT-PCR analyses of iRFP-shCHOP RNA ranges of HEK293/tTA_shCHOP cells handled with tunicamycin (10 μg/mL) and tetracycline (10 μg/mL). Relative RNA expression ranges had been obtained by normalizing the RNA expression ranges of handled cells to that of untreated cells at preliminary circumstances (0 h). d, e Quantitative RT-PCR analyses of CHOP (d) and ATF5 (e) mRNA ranges of HEK293 and HEK293/tTA_shCHOP cells handled with tunicamycin (10 μg/mL). Relative mRNA expression ranges had been obtained by normalizing the mRNA expression ranges of handled cells to that of untreated HEK293 cells at preliminary circumstances (0 h). f Consultant move cytometry histograms of Annexin V-FITC-stained HEK293 and HEK293/tTA_shCHOP cells untreated or handled with tunicamycin (10 μg/mL) for 48 hours. Information are reported as imply ± s.e.m. (n = 3 organic replicates). P-values had been calculated utilizing an unpaired Scholar’s t-test with a two-tailed evaluation. Supply information are supplied as a Supply Information file.
To confirm that activation of the CHOP silencing response is dependent upon UPR induction and is managed by tTA exercise, we monitored the iRFP fluorescence of HEK293/tTA_shCHOP cells upon tunicamycin and tetracycline therapy. Tunicamycin therapy (10 μg/ml, 48 hours) resulted in a 2.7-fold enhance in iRFP fluorescence in comparison with untreated cells (Fig. 5b), which signifies expression of the iRFP-shCHOP cassette in response to UPR induction. Upon the addition of tetracycline (1 μg/ml), tunicamycin-treated cells displayed a 70% lower in iRFP fluorescence ranges in comparison with tunicamycin-only handled cells and a 19% lower in iRFP fluorescence ranges in comparison with untreated cells, indicating that the rise in iRFP expression upon UPR induction is dependent upon tTA exercise and suggesting basal expression of tTA at resting situation seemingly on account of basal ranges of XBP1 splicing. To verify expression of the iRFP-shCHOP transcript, we monitored the RNA ranges of iRFP-shCHOP in HEK293/tTA_shCHOP cells handled with tunicamycin (10 μg/ml) and tetracycline (10 μg/ml) by quantitative RT-PCR utilizing primers designed to amplify from the three’ finish of iRFP to the three’ finish of miR-30 (Supplementary Desk 1). We noticed an 8-fold enhance within the iRFP-shCHOP RNA ranges after 12 hours of therapy with tunicamycin in comparison with untreated cells, which decreased by 43% after 48 hours (Fig. 5c). iRFP-shCHOP RNA ranges in cells handled with tetracycline had been 74% decrease than in untreated cells, confirming tTA management and basal activation of XBP1 splicing, as seen earlier than (Fig. 5b). These outcomes reveal that these cells induce CHOP silencing upon ER stress and that shCHOP expression is mediated by tTA, confirming that tTA interfaces the IRE1 pathway with silencing of the pro-apoptotic pathway.
To confirm that the activation of the CHOP silencing circuit in response to XBP1 activation results in the knockdown of CHOP mRNA, we monitored CHOP mRNA ranges upon cell therapy with tunicamycin utilizing quantitative RT-PCR. HEK293 cells displayed a gradual enhance in CHOP mRNA ranges upon tunicamycin therapy (10 μg/ml), particularly a 15-fold enhance after 12 hours and a 43-fold enhance after 48 hours (Fig. 5d). HEK293/tTA_shCHOP cells displayed the same enhance in CHOP mRNA ranges after the primary 12 hours of tunicamycin therapy however remained fixed after 24 hours and 36 hours of therapy (p > 0.1) and displayed solely a light enhance after 48 hours. The restricted change in CHOP mRNA ranges noticed in HEK293/tTA_shCHOP cells handled with tunicamycin over time, which reached lower than half of the CHOP mRNA ranges of parental HEK293 cells, signifies that the expression of shCHOP upon UPR induction ends in the knockdown of CHOP expression.
To additional characterize the extent to which activation of the CHOP silencing circuit inhibits CHOP-mediated signaling, we additionally monitored the mRNA ranges of the CHOP downstream goal ATF5 upon cell publicity to tunicamycin. HEK293 cells handled with tunicamycin (10 μg/ml) displayed a 2.5-fold enhance in ATF5 mRNA ranges after 12 hours and reached a 5.5-fold enhance after 48 hours in comparison with untreated cells (Fig. 5e). HEK293/tTA_shCHOP cells displayed a 2.2-fold enhance in ATF5 mRNA ranges after 12 hours of tunicamycin therapy and reached a most 3-fold enhance in ATF5 mRNA ranges after 48 hours (in comparison with the 5.5-fold enhance in HEK293 cells). Just like CHOP mRNA ranges, ATF5 mRNA ranges in HEK293/tTA_shCHOP cells had been discovered to be about 50% decrease than in parental HEK293 cells, indicating that activation of CHOP silencing in response to the detection of XBP1 activation results in the suppression of CHOP downstream signaling.
To guage the impact of the CHOP silencing circuit on mobile apoptosis, we monitored the membrane rearrangement attribute of early apoptosis in HEK293 cells and cells engineered with the CHOP silencing circuit upon ER stress. HEK293 and HEK293/tTA_shCHOP cells had been handled with tunicamycin (10 μg/ml, 48 hours), and early apoptosis was measured utilizing move cytometry by quantifying the binding of Annexin V to phosphatidylserine, a residue situated within the internal leaflet of the plasma membrane that turns into uncovered to the outer cell floor throughout early apoptosis. Remedy of HEK293 cells with tunicamycin elevated the Annexin V-positive inhabitants in comparison with untreated cells (Fig. 5f and Supplementary Fig. 7). The Annexin V-positive inhabitants of HEK293/tTA_shCHOP cells was discovered to not enhance upon tunicamycin therapy and, notably, to be corresponding to that of parental HEK293 cells. These outcomes recommend that activation of the CHOP silencing circuit reduces the activation of UPR-induced apoptosis noticed upon ER stress.
Suggestions-regulated management of XBP1s expression and CHOP silencing amplifies XBP1s signaling and reduces CHOP response
We requested whether or not combining the amplification of XBP1s signaling with inhibition of the CHOP-mediated pro-apoptotic response would offer a extra sturdy cytoprotective response to ER stress, finally enabling cells to adapt to the calls for related to excessive expression of recombinant proteins. To handle this query, we engineered the IRE1 sensor (HEK293/tTA cells) with a suggestions response mediating XBP1s overexpression and CHOP silencing. We designed an expression cassette containing XBP1s adopted by an IRES and iRFP, with shCHOP inserted on the 3’UTR of iRFP. The expression cassette was positioned below the management of the TRE promoter to allow activation by tTA (Fig. 6a). The ensuing assemble, XBP1s_IRES_iRFP-shCHOP, was built-in into the IRE1 sensor utilizing lentivirus transduction. Secure cell traces had been expanded and diluted to isolate monoclonal populations (HEK293/tTA_XBP1s_shCHOP). Single HEK293/tTA_XBP1s_shCHOP clones had been handled with tunicamycin (1 μg/ml, 48 hours), and the iRFP fluorescence was measured utilizing move cytometry (Supplementary Fig. 8). Two clones (#1.1 and #2.1) had been chosen that show a change in iRFP sign upon tunicamycin therapy just like the HEK293/tTA_XBP1s clones #1 and #2, respectively (Supplementary Fig. 8, orange bars). To confirm that HEK293/tTA_XBP1s_shCHOP cells reply to UPR activation and that tTA mediates this response, we monitored the iRFP fluorescence of clones #1.1 and #2.1 upon tunicamycin and tetracycline therapy. Tunicamycin therapy (10 μg/ml, 48 hours) resulted in a 2.8- and 6.9-fold enhance in iRFP fluorescence of HEK293/tTA_XBP1s_shCHOP #1.1 and #2.1, respectively (Fig. 6b, c). Including tetracycline (1 μg/ml) to tunicamycin-treated cells decreased the iRFP fluorescence to values decrease than these of untreated cells, as noticed earlier than (Figs. 4b, c, 5b). These outcomes point out that expression of the XBP1s_IRES_iRFP-shCHOP cassette is activated upon UPR induction and is mediated by tTA.

a Schematic illustration of the sense-and-respond system for amplifying XBP1s and silencing CHOP expression in response to XBP1 splicing. The sense-and-respond system (HEK293/tTA_XBP1s_shCHOP cells) was constructed by integrating a cassette encoding XBP1s, an IRES, and iRFP adopted by the miR30-based anti-CHOP shRNA (shCHOP) below the management of tTA within the genome of the IRE1 sensor (HEK293/tTA cells). b,c iRFP sign of HEK293/tTA_XBP1s_shCHOP clones #1.1 (b) and #2.1 (c) handled with tunicamycin (10 μg/mL) and tetracycline (1 μg/mL) for 48 hours and measured by move cytometry. iRFP fold change values had been obtained by normalizing the iRFP fluorescence values of handled cells to that of untreated cells. d,e Quantitative RT-PCR analyses of XBP1s (d) and ERdj4 (e) mRNA ranges of HEK293 and HEK293/tTA_ XBP1s_shCHOP cells handled with tunicamycin (10 μg/mL). Relative mRNA expression ranges had been obtained by normalizing the mRNA ranges of handled cells to the expression ranges of untreated cells. f Quantitative RT-PCR analyses of iRFP-shCHOP RNA ranges of HEK293/tTA_XBP1s_shCHOP cells handled with tunicamycin (10 μg/mL). Relative RNA expression ranges had been obtained by normalizing the RNA ranges of handled cells to the expression ranges of untreated HEK293/tTA_XBP1s_shCHOP #1.1 cells at preliminary circumstances (0 h). g,h Quantitative RT-PCR analyses of CHOP (g) and ATF5 (h) mRNA ranges of HEK293 and HEK293/tTA _XBP1s_shCHOP cells handled with tunicamycin (10 μg/mL). Relative mRNA expression ranges had been obtained by normalizing the mRNA ranges of handled cells to that of untreated HEK293 cells at preliminary circumstances (0 h). f MTS absorbance of HEK293 and HEK293/tTA_XBP1s_shCHOP cells handled with tunicamycin (10 μg/mL) relative to untreated cells. Information are reported as imply ± s.e.m. (n = 3 organic replicates). P values had been calculated utilizing an unpaired Scholar’s t-test with a two-tailed evaluation. Supply information are supplied as a Supply Information file.
To characterize the habits of the sense-and-response system designed to amplify XBP1s and shCHOP expression upon ER stress, we first monitored XBP1s and ERdj4 mRNA ranges. Particularly, HEK293/tTA_XBP1s_shCHOP #1.1 and #2.1 and parental HEK293 cells had been handled with tunicamycin (10 μg/ml), and the mRNA ranges had been measured utilizing quantitative RT-PCR. Parental HEK293 cells displayed a gradual enhance in XBP1s mRNA ranges that reached a 7-fold change after 48 hours of tunicamycin therapy (Fig. 6d). HEK293/tTA_XBP1s_shCHOP #1.1 displayed a 6.5-fold enhance in XBP1s mRNA ranges after 12 hours of therapy, which decreased by 43% after 36 hours and remained fixed for the following 12 hours. HEK293/tTA_XBP1s_shCHOP #2.1 displayed a 24-fold enhance in XBP1s mRNA ranges after 24 hours of therapy and decreased to ranges corresponding to untreated cells after 48 hours. Just like XBP1s mRNA ranges, HEK293 cells displayed a relentless enhance in ERdj4 mRNA ranges that reached a 4.1-fold change after 48 hours of tunicamycin therapy (Fig. 6e). HEK293/tTA_XBP1s_shCHOP #1.1 displayed a peak 4.4-fold enhance in ERdj4 mRNA ranges after 12 hours of therapy that decreased by 19% after 48 hours. HEK293/tTA_XBP1s_shCHOP #2.1 displayed a 13-fold enhance in ERdj4 mRNA ranges after 24 hours of therapy, which decreased by 87% after 48 hours, reaching ERdj4 mRNA ranges decrease than these of parental HEK293 cells. The rise in XBP1s and ERdj4 mRNA ranges of HEK293/tTA_XBP1s_shCHOP clones in comparison with parental HEK293 cells after 12-24 hours of tunicamycin therapy is indicative of self-amplification of XBP1s expression upon ER stress, and the extent of upregulation of XBP1s and ERdj4 expression within the HEK293/tTA_XBP1s_shCHOP clones displays the change in iRFP sign, with the clone presenting a bigger iRFP fold change (#2.1) displaying a bigger enhance in XBP1s and ERdj4 mRNA ranges.
To guage the amplification of the CHOP silencing response in HEK293/tTA_XBP1s_shCHOP, we first monitored iRFP-shCHOP RNA ranges by quantitative RT-PCR utilizing primers designed to amplify from the three’ finish of iRFP to the three’ finish of miR-30 (Supplementary Desk 1). HEK293/tTA_XBP1s_shCHOP #1.1 displayed 55-fold enhance in iRFP-shCHOP RNA ranges after 12 hours of tunicamycin therapy (10 μg/ml), which decreased mildly at later occasions (Fig. 6f). HEK293/tTA_XBP1s_shCHOP #2.1 displayed a 3.2-fold enhance within the iRFP-shCHOP RNA ranges in comparison with clone #1.1 at basal circumstances (Fig. 6f, 0 hours). Clone #2.1 displayed a 174-fold enhance in iRFP-shCHOP RNA ranges after 12 hours of therapy, which decreased by 89% after 48 hours. Notably, the extent of iRFP-shCHOP RNA expression within the HEK293/tTA_XBP1s_shCHOP clones displays the change in iRFP sign, with the clone presenting a bigger amplification of the suggestions response (#2.1) displaying a bigger enhance in iRFP-shCHOP RNA ranges.
To confirm that the expression of shCHOP in response to ER stress results in the knockdown of CHOP mRNA, we monitored CHOP and ATF5 mRNA ranges upon cell therapy with tunicamycin (10 μg/ml). HEK293 cells displayed a gradual enhance in CHOP mRNA ranges upon tunicamycin therapy, from a 16-fold enhance after 12 hours of therapy to a 40-fold enhance after 48 hours (Fig. 6g). HEK293/tTA_XBP1s_shCHOP #1.1 displayed CHOP mRNA ranges corresponding to parental cells at early time factors and mildly decrease at later time factors. HEK293/tTA_XBP1s_shCHOP #2.1 displayed a 25-fold enhance in CHOP mRNA ranges after 12 hours of therapy, which decreased by 58% after 36 hours of therapy and remained fixed for the following 12 hours, about 3-fold decrease than in parental cells. Just like CHOP mRNA ranges, HEK293 cells displayed a 2.1-fold enhance in ATF5 mRNA ranges after 12 hours of therapy and reached a 4.5-fold enhance after 48 hours (Fig. 6h). HEK293/tTA_XBP1s_shCHOP #1.1 displayed comparable ATF5 mRNA ranges (p > 0.1) to HEK293 cells upon tunicamycin therapy. HEK293/tTA_XBP1s_shCHOP #2.1 didn’t show a rise in ATF5 mRNA ranges upon tunicamycin therapy, which remained dramatically decrease than in parental cells. The considerably decrease CHOP and ATF5 mRNA ranges noticed after 48 hours of tunicamycin therapy within the clone presenting a bigger amplification of iRFP-shCHOP transcript ranges (#2.1) signifies that the expression of excessive ranges of shCHOP upon UPR induction ends in the knockdown of CHOP expression and suppression of its downstream signaling.
To guage the cytoprotective impact of the sense-and-respond system mediating XBP1s upregulation and CHOP silencing, we monitored the viability of HEK293/tTA_XBP1s_shCHOP cells. HEK293/tTA_XBP1s_shCHOP #1.1 and #2.1 and parental HEK293 cells had been handled with tunicamycin (10 μg/ml, 48 hours), and cell viability was monitored utilizing the MTS assay. HEK293/tTA_XBP1s_shCHOP #2.1 displayed a 42% enhance in viability in comparison with HEK293 cells, whereas HEK293/tTA_XBP1s_shCHOP #1.1 displayed ranges corresponding to parental cells (Fig. 6i). The upper cell viability within the HEK293/tTA_XBP1s_shCHOP clone with excessive expression of the suggestions response in comparison with parental cells signifies that amplification of XBP1s mixed with CHOP silencing attenuates ER stress.
Suggestions-regulated management of XBP1s expression and CHOP silencing enhances tPA manufacturing
We requested whether or not the suggestions management methods mediating stress attenuation via self-amplification of XBP1s signaling and apoptosis delay via CHOP silencing have an effect on the manufacturing of the secretory protein tPA. We transduced HEK293 cells and the three by-product cell traces engineered to amplify XBP1s expression (HEK293/tTA_XBP1s), inhibit CHOP expression (HEK293/tTA_shCHOP), and mix the 2 responses (HEK293/tTA_XBP1s_shCHOP), with viral particles encoding hPLAT linked to GFP by an IRES (Fig. 7a) utilizing a excessive MOI (Fig. 2). To evaluate the extent of activation of the response cassettes upon transgene expression, we measured the iRFP fluorescence of transduced (GFP-positive) cells utilizing move cytometry. Notably, the iRFP sign of cells chosen primarily based on excessive suggestions response amplification (HEK293/tTA_XBP1s #2 and HEK293/tTA_XBP1s_shCHOP #2.1) was greater than that of cells chosen primarily based on low suggestions response amplification (HEK293/tTA_XBP1s #1 and HEK293/tTA_XBP1s_shCHOP #1.1) (Supplementary Fig. 9a), indicating that the relative extents of suggestions response amplification ensuing from UPR induction by way of chemical therapy correlate with these noticed upon UPR induction by way of secretory protein overexpression. To guage the correlation between transgene expression and the activation of the feedback-controlled genetic circuits, we quantified the iRFP sign (indicative of the extent of activation of the response cassettes) in subpopulations of transduced cells with excessive and low GFP sign (indicative of transgene expression). Excessive and low GFP indicators had been outlined by gating subpopulations of transduced (GFP-positive) cells similar to the decrease and higher 15% of the GFP-positive distribution. The upper iRFP imply fluorescence within the excessive GFP subpopulations in comparison with the low GFP subpopulations confirms the correlation between transgene expression and UPR response (Supplementary Fig. 9b-f). We then evaluated the manufacturing of secreted practical tPA in transduced (GFP-positive) cells by measuring tPA exercise of cell supernatants. 9 days after cell transduction, we noticed a 57% enhance in tPA manufacturing in cells with excessive expression of the suggestions response combining XBP1s amplification and CHOP silencing (HEK293/tTA_XBP1s_shCHOP clone #2.1) in comparison with parental HEK293 cells (Fig. 7b). Measurements carried out 23 days post-transduction revealed sustained tPA manufacturing in cells engineered with excessive suggestions response; particularly, we noticed a 23% enhance in cells with XBP1s amplification in comparison with HEK293 cells and a 46% enhance in cells combining XBP1s amplification and CHOP silencing (Fig. 7c). These outcomes recommend that amplification of the IRE1 pathway will increase the secretion of practical tPA and that combining amplification of IRE1 signaling with delay of CHOP-mediated apoptosis additional enhances tPA manufacturing.

a Schematic illustration of the protein expression system for tPA manufacturing consisting of the three feedback-regulated engineered cell traces, HEK293/tTA_XBP1s, HEK293/tTA_shCHOP, and HEK293/tTA_XBP1s_shCHOP, transduced with virus expressing tPA and GFP at an MOI of 35 (excessive). b tPA exercise of HEK293, HEK293/tTA_XBP1s, HEK293/tTA_shCHOP, and HEK293/tTA_XBP1s_shCHOP cells transduced with virus expressing tPA at an MOI of 35 (excessive) measured 9 days post-transduction. c tPA exercise of HEK293, HEK293/tTA_XBP1s #2, and HEK293/tTA_XBP1s_shCHOP #2.1 cells transduced with virus expressing tPA at an MOI of 35 (excessive) measured 23 days post-transduction. d tPA exercise of HEK293 and HEK293/tTA_XBP1s_shCHOP #2.1 cells transduced with virus expressing tPA at an MOI of 35 (excessive) measured 48 days post-transduction. e Caspase exercise of cells as in d measured 48 days post-transduction. The relative caspase exercise was calculated by normalizing the caspase exercise of cells transduced to overexpress tPA by that of cells transduced with a management vector. f tPA exercise of HEK293 and HEK293/tTA_XBP1s_shCHOP #2.1 cells transduced with virus expressing tPA at an MOI of 35 (excessive) and handled with tunicamycin 45 days post-transduction for 72 hours. g The ratio of the tPA exercise of HEK293/tTA_XBP1s_shCHOP #2.1 to HEK293 cells transduced and handled with tunicamycin as in f. Information are reported as imply ± s.e.m. (n = 3 organic replicates). P values had been calculated utilizing an unpaired Scholar’s t-test with a two-tailed evaluation. Supply information are supplied as a Supply Information file.
Given the excessive protein productiveness sustained by the cells combining XBP1s amplification and CHOP silencing with excessive expression of the suggestions response, we evaluated the impact of long-term tPA overexpression (48 days) in parental HEK293 and HEK293/tTA_XBP1s_shCHOP #2.1 cells. We noticed a common lower within the ranges of secreted energetic tPA in each parental and engineered cells in comparison with what was noticed at earlier time factors, as anticipated, as a result of sustained proteotoxic stress induced by extended protein overexpression. Nevertheless, tPA productiveness in HEK293/tTA_XBP1s_shCHOP #2.1 was 26% greater than in parental HEK293 (Fig. 7d), suggesting that combining amplification of XBP1s signaling with CHOP silencing helps tPA manufacturing. Measurements of apoptosis induction quantified by monitoring caspases 3 and seven exercise revealed a 40% enhance in apoptotic exercise in parental HEK293 cells expressing tPA in comparison with management cells missing the hPLAT gene (Fig. 7e), indicating that extended hPLAT overexpression induces the activation of pro-apoptotic caspases. HEK293/tTA_XBP1s_shCHOP #2.1 cells expressing tPA displayed caspase exercise ranges comparable to manage cells missing the hPLAT gene, suggesting that combining the amplification of XBP1s signaling with CHOP silencing reduces the pro-apoptotic impact induced by extended hPLAT overexpression.
To additional consider the suggestions management system mediating modulation of XBP1s and CHOP signaling, we assessed the manufacturing of practical tPA in cells overexpressing hPLAT and handled with tunicamycin to irritate ER stress. HEK293 and HEK293/tTA_XBP1s_shCHOP #2.1 cells had been handled with tunicamycin (0-1 μg/ml) 45 days post-transduction. The addition of tunicamycin prompted a lower in tPA manufacturing in a dose-dependent vogue, as anticipated (Fig. 7f). Nevertheless, cells engineered with the suggestions circuit mediating XBP1s overexpression and CHOP silencing sustained greater productiveness than parental cells. The productiveness of HEK293/tTA_XBP1s_shCHOP #2.1 cells elevated with growing stress circumstances (i.e., tunicamycin dosage). Notably, the rise in tPA exercise in HEK293/tTA_XBP1s_shCHOP #2.1 cells in comparison with parental HEK293 cells upon therapy with excessive doses of tunicamycin was 67% greater than in untreated cells (Fig. 7g), suggesting that our sense-and-respond system mediating amplification of XBP1s signaling and CHOP silencing helps greater ranges of tPA manufacturing upon induction of further ER stress.
Suggestions-regulated management of XBP1s expression and CHOP silencing offers a platform for enhanced therapeutic protein manufacturing
To evaluate the potential use of the sense-and-respond system mediating amplification of XBP1s signaling and inhibition of CHOP-mediated apoptosis as a common platform to assist the manufacturing of recombinant proteins, we evaluated the manufacturing of the monoclonal antibody blinatumomab. Monoclonal antibodies signify the most important class of organic therapeutics in scientific use. Blinatumomab is a bispecific T-cell engager consisting of two variable antibody fragments that concentrate on the CD19 transmembrane protein on B-cells and the CD3 protein complicated on T-cells, enabling the immune system to assault focused leukemic cells47. Blinatumomab (Blincyto) is a novel immunotherapy therapy choice for relapsed or refractory B-cell precursor acute lymphoblastic leukemia (ALL), traditionally related to low affected person survival outcomes48.
To guage the impact of XBP1s amplification and CHOP silencing on blinatumomab manufacturing, we transiently transfected cells with excessive feedback-regulated amplification of XBP1s (HEK293/tTA_XBP1s #2) and mixing XBP1s amplification and CHOP silencing (HEK293/tTA_XBP1s_shCHOP #2.1) with a plasmid expressing the gene encoding blinatumomab linked to GFP by an IRES. To look at the extent of activation of the response cassettes upon transgene expression, we measured the iRFP fluorescence of transduced (GFP-positive) cells utilizing move cytometry. Apparently, HEK293/tTA_XBP1s #2 and HEK293/tTA_XBP1s_shCHOP #2.1 cells expressing blinatumomab exhibited iRFP fluorescence ranges corresponding to these of cells producing tPA (Supplementary Figs. 9a, 10). We then evaluated the manufacturing of blinatumomab in transduced (GFP-positive) cells by measuring the focus of blinatumomab in cell supernatants. We noticed a 34% enhance in blinatumomab manufacturing in cells with XBP1s amplification (HEK293/tTA_XBP1s #2) in comparison with HEK293 cells and a 52% enhance in cells combining XBP1s amplification and CHOP silencing (HEK293/tTA_XBP1s_shCHOP clone #2.1) (Fig. 8). These outcomes recommend that our sense-and-respond system mediating amplification of XBP1s signaling and CHOP silencing improves the manufacturing of various courses of recombinant proteins, doubtlessly offering a common platform for cell factories with improved and sustained manufacturing of therapeutic proteins.

Blinatumomab manufacturing of HEK293, HEK293/tTA_XBP1s #2, and HEK293/tTA_XBP1s_shCHOP #2.1 cells transfected with a plasmid expressing blinatumomab and GFP for 72 hours and measured by ELISA. Blinatumomab ranges are normalized to the blinatumomab ranges of HEK293 cells. Information are reported as imply ± s.e.m. (n = 3 organic replicates). P values had been calculated utilizing an unpaired Scholar’s t-test with a two-tailed evaluation. Supply information are supplied as a Supply Information file.