mRNA synthesis
The template for in vitro transcription (IVT) of glycosylphosphatidylinositol-aVHH was bought from Built-in DNA Applied sciences. The sequences (Supplementary Desk 1) had been codon-optimized for mouse (major species) and human (secondary species) utilizing the GenSmart Codon Optimization instrument (GenScript). The linear IVT templates had been amplified by PCR utilizing ahead and T120 prolonged reverse primers, then purified with the DNA Clear & Concentrator Package (Zymo Analysis). The MEGAscript T7 Transcription Package (Invitrogen) was used for IVT for two h at 37 °C. Through the response, mRNA was capped with Cap 1 (BOC Sciences) and all UTPs had been modified with N1-methylpseudouridine-5′-triphosphate (N1-MeΨTP, BOC Sciences). After 2 h, DNase I used to be handled to take away the template DNA for 15 min at 37 °C. The ensuing mRNA was purified by lithium chloride precipitation. Purified RNA merchandise had been analyzed by gel electrophoresis to make sure purity.
Nanoparticle formulation
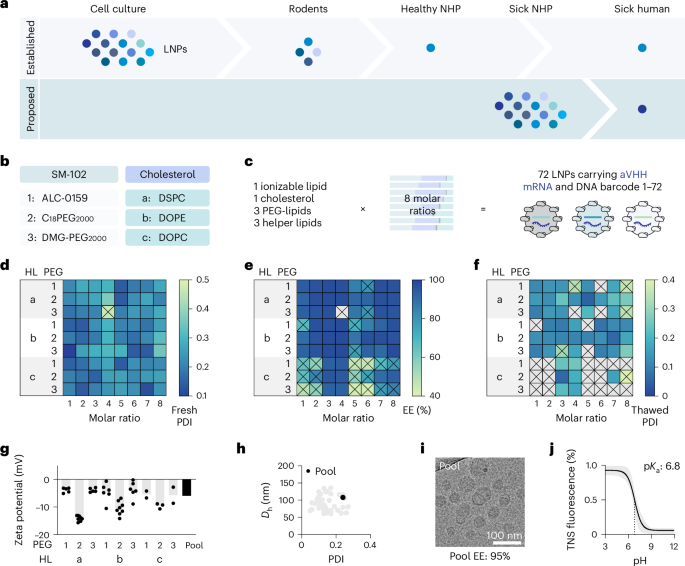
LNPs had been formulated with aVHH mRNA23,24,25. The lipid elements had been diluted in 100% ethanol. Seventy-two completely different compositions are listed in Supplementary Fig. 2. DNA barcodes (Built-in DNA Applied sciences; sequences listed in Supplementary Desk 1) had been blended within the nucleic acid section at a 1:10 ratio of DNA barcodes to mRNA in 25 mM sodium acetate buffer. The phases had been then microfluidically blended32,33 utilizing Ignite (Precision Nanosystems) at a movement fee of three:1 (nucleic acid:lipid phases) at a complete movement fee of 12 ml min−1. LNPs had been diluted 1:42 in sterile 10 mM Tris buffer and dialyzed by centrifugation in 100-kDa ultracentrifuge tubes (Amicon) at 4 °C. Then the LNPs had been sterile-filtered with a 0.22-µm filter earlier than administration or downstream evaluation.
LNP characterization
Hydrodynamic diameters and PDIs of LNPs had been measured utilizing high-throughput dynamic mild scattering (DynaPro Plate Reader II, Wyatt). DYNAMICS software program (model 8.3.1.1145, Wyatt) was used for information assortment. Endotoxin ranges had been measured with the Pierce Chromogenic Endotoxin Quant Package (Thermo Scientific) earlier than administration (Supplementary Fig. 4). The usual vary of 0.01–0.1 endotoxin models (EU) ml−1 was used following the producer’s protocol. Encapsulated mRNA and encapsulation effectivity had been evaluated utilizing Quant-iT RiboGreen RNA assay equipment (Thermo Fisher Scientific). Briefly, an equal quantity of 6 ng μl−1 LNP and 1× Tris–EDTA (TE; Thermo Fisher) or 2% Triton X-100 (Sigma-Aldrich) in 1× TE had been blended. After incubation at 37 °C for 10 min, an equal quantity of 1:100 of RiboGreen reagent (Thermo Fisher) was added to every effectively. The fluorescence was quantified utilizing a plate reader (PerkinElmer Victor X4 Microplate Reader) at an excitation wavelength of 485 nm and an emission wavelength of 528 nm. PerkinElmer 2030 Workstation software program 4.0 (model 4.00.0.15) was used for information assortment. The zeta potential was measured utilizing a Malvern Zetasizer Nano Z. Zetasizer software program (model 8.02) was used for information assortment. The measurement was completed with the refractive index of 1.4, dispersant viscosity of 0.882 cP and refractive index of 1.33.
Freeze–thawing of LNPs
Sucrose (Nationwide Formulary, European Pharmacopoeia, Japanese Pharmacopoeia, Chinese language Pharmacopoeia, excessive purity, low endotoxin; Fisher Scientific) was dissolved in a sterile 10 mM Tris buffer at 60% (w/v). LNPs in 10 mM Tris buffer had been blended with 60% (w/v) sucrose resolution at 5:1 (v/v LNP:sucrose) for a last focus of sucrose at 10% (w/v). LNPs had been then flash-frozen in liquid nitrogen. Hydrodynamic diameter, PDI and encapsulation effectivity had been measured earlier than and after freeze–thawing. Frozen LNPs had been saved at ≤−120 °C within the vapor section of liquid nitrogen. For thawing, LNPs had been incubated at room temperature for 20 min.
LNP choice for pooling
After formulation, LNPs with PDI underneath 0.4 had been chosen (71 out of 72 LNPs). Then, LNPs with encapsulation effectivity above 85% had been chosen (50 out of 71 LNPs). As a 3rd step, we measured the PDI and hydrodynamic diameter of those 50 LNPs after they had been blended with 10% sucrose, frozen and thawed. Forty-five formulations remained monodisperse with a hydrodynamic diameter between 50 nm and 150 nm and a PDI under 0.3. The frozen aliquots of chosen 45 LNPs had been thawed and pooled to evaluate the bodily traits. Hydrodynamic diameter, PDI, zeta potential, encapsulation effectivity, encapsulated mRNA, endotoxin stage and pOkaya had been measured for the LNP pool. The LNP pool was additionally imaged by cryo-TEM. Earlier than every administration, 1-ml aliquots of these 45 frozen LNPs had been thawed at room temperature and pooled. Every time, the hydrodynamic diameter, PDI, zeta potential, encapsulation effectivity, encapsulated mRNA and endotoxin stage had been measured.
Cryo-TEM
LNP samples had been positioned on 300-mesh copper grids, with a holey carbon substrate (1.2-µm holes spaced by 1.3 µm; C-flat, Electron Microscopy Sciences). Grids had been glow-discharged (destructive cost) for 15 s utilizing a GloQube Plus glow discharge system (Quorum Tech). Samples (3 µl) had been blotted with filter paper for 1 s at room temperature and 100% humidity and plunge-frozen into liquid ethane utilizing a Vitrobot Mark IV (Thermo Scientific). Cryo-EM grids had been saved in liquid nitrogen till cryo-TEM information acquisition. Cryo-EM grids had been loaded underneath liquid nitrogen temperatures, utilizing a Gatan 914 cryo-TEM pattern holder, right into a JEOL JEM-2200FS TEM (JEOL) working at 200 keV. Micrographs had been acquired underneath low-dose circumstances utilizing the Serial EM software program (v4.1.6)57 with a DE20 direct electron detector system (Direct Electron), at nominal magnifications of ×40,000 or ×80,000, yielding pixel sizes of 1.4 Å and 0.8 Å per pixel, respectively.
pOkay
a assay
A inventory resolution of 10 mM HEPES (Sigma-Aldrich), 10 mM 2-(N-morpholino)ethanesulfonic acid (Sigma-Aldrich), 10 mM sodium acetate (Sigma-Aldrich) and 140 mM sodium chloride (Sigma-Aldrich) was ready and pH adjusted with hydrogen chloride and sodium hydroxide (pH 3–10). Utilizing 4 replicates for every pH, 140 μl pH-adjusted buffer was added to a 96-well plate, adopted by including 5 μl of 2-(p-toluidino)-naphthalene-6-sulfonic acid (60 μg ml−1). LNPs (5 µl) had been added to every effectively. After 5 min of incubation at 300 rpm, fluorescence (excitation 325 nm, emission 435 nm) was measured utilizing a plate reader.
Mouse experiments
All mouse experiments had been carried out in accordance with the approval of the Emory College College of Medication’s Institutional Animal Care and Use Committee. All animals had been housed within the Emory College animal services. C57BL/6J mice had been bought from The Jackson Laboratory. All mice had been housed within the Emory College animal services in typical cages with a 12:12 h mild–darkish cycle and advert libitum entry to meals and water. The vivarium was saved at 23 °C with 50% humidity. Mice (N = 3) had been injected intravenously with LNP pool (0.5 mg kg−1) within the lateral tail vein.
Mouse cell isolation and marking
Mice had been euthanized by CO2 asphyxiation, adopted by cervical dislocation and perfusion with 5 ml of 1× phosphate-buffered saline (PBS) by means of the suitable atrium. Liver tissues had been finely minced after which positioned in a digestive enzyme resolution together with collagenase sort I (Sigma-Aldrich), collagenase XI (Sigma-Aldrich) and hyaluronidase (Sigma-Aldrich). The combination was then incubated at 37 °C, 550 rpm for 45 min (refs. 58,59). For bone marrow, each ends of the femur had been minimize and 5 ml of RPMI1640 (Sigma-Aldrich) per femur was flushed utilizing a 25-gauge needle. Spleens had been finely minced and positioned in RPMI1640. Cell suspensions had been filtered by means of a 70-µm mesh. Blood was collected from terminal cardiac puncture, then purple blood cells had been lysed by ACK lysing buffer (High quality Organic) following the producer’s protocol. Cells had been stained to determine particular cell populations and sorted utilizing the Cytek Aurora cell sorter. SpectroFlo software program (model 1.3.1, Cytek) was used for information assortment. The anti-mouse antibody clones and dilutions used had been the next: anti-mouse erythroid cells (TER119, BioLegend, 1:500), anti-CD31 (390, BD, 1:500), anti-CD45.2 (104, BioLegend, 1:500), anti-CD19 (6D5, BioLegend, 1:500), anti-CD3 (17A2, BioLegend, 1:500), anti-CD11c (N418, BioLegend, 1:500) and anti-CD11b (M1/70, BioLegend, 1:500). LIVE/DEAD Fixable Blue Lifeless Cell Stain Package (Invitrogen) was used for dwell cell gating (dilution 1:5000). Stream cytometry staining panels and gating methods are proven in Supplementary Figs. 6 and 7. Mice injected with 10 mM Tris buffer had been used as gating controls.
Rhesus monkey research
All animal procedures conformed to the necessities of the Animal Welfare Act, and protocols had been accredited earlier than implementation by Emory College College of Medication’s Institutional Animal Care and Use Committee. The LNPs had been thawed, screened (for instance, sterility and endotoxin) after which aliquoted for intravenous injection underneath aseptic circumstances in rhesus monkeys (N = 6; 1–17 years of age, 2.3–6 kg; 3 males and three females) evaluating the 2 medical statuses (wholesome versus gastrointestinal irritation); one uninjected management animal (11 years, 7.2 kg, feminine) and one uninjected EoL animal (17 years, 9 kg, male) had been included. Animals had been sedated with telazol (5–8 mg kg−1 intramuscularly), a blood pattern was collected at time level 0 and a gradual intravenous injection of LNPs was carried out utilizing the aseptic approach. Animals had been pretreated with diphenhydramine, and no adversarial reactions had been noticed. Full blood counts and medical chemistry panels had been evaluated earlier than and after administration and located to be inside regular limits. Animals had been sedated 24 h after administration and weighed, their last blood samples had been collected (serum and peripheral blood mononuclear cells) after which the animals had been euthanized (overdose of pentobarbital). Tissues had been collected and weighed together with the liver, spleen and bone marrow from all lengthy bones.
Rhesus cell isolation and marking
Liver tissues had been minimize into 0.5-cm cubes, positioned right into a digestive enzyme resolution containing 12 ml of R5 medium (RPMI1640 supplemented with 5% fetal bovine serum) supplemented with 150 µg ml−1 of collagenase sort I (Sigma-Aldrich), and processed utilizing a GentleMACS Octo Dissociator with heaters (Miltenyi Biotec). The samples had been processed utilizing the next protocol: incubation at 37 °C, two units of clockwise–counterclockwise agitations at 300 rpm for 20 s, two units of clockwise–counterclockwise agitations at 50 rpm for 40 min and two units of clockwise–counterclockwise agitations at 300 rpm for 20 s. Spleen tissues had been minimize into 0.5-cm cubes, positioned into 5 ml of R5 medium and processed utilizing a GentleMACS Octo Dissociator with heaters (Miltenyi Biotec) utilizing the m_spleen_1 program. Liver and spleen tissues had been taken off the GentleMACS, and bone marrow samples had been resuspended in 10 ml of R5 medium. All samples had been handed by means of a 70-µm mesh prewet with 1 ml of R5 medium. After centrifugation at 500g for 10 min, all samples had been incubated with ACK lysis buffer for five min. Single-cell suspensions had been then washed twice with PBS. Forty million cells had been incubated with Fc receptor binding inhibitor polyclonal antibody (Invitrogen) for 20 min at 4 °C. Cells had been stained to determine particular cell populations and sorted utilizing the Cytek Aurora cell sorter. SpectroFlo software program (model 1.3.1, Cytek) was used for information assortment. The antibody clones and dilutions used had been the next: anti-human CD31 (WM59, BD, 1:50), anti-human ASGPR (REA608, Miltenyi, 1:50), anti-NHP CD45 (D058-1283, BD, 1:50), anti-NHP CD3 (10D12, Miltenyi, 1:50), anti-NHP CD20 (2H7, BioLegend, 1:50), anti-NHP HLA-DR (G46-6/L243, BD, 1:50), anti-NHP CD16 (3G8, BD, 1:50) and anti-NHP CD14 (M5E2, BD, 1:50). The LIVE/DEAD Fixable Blue Lifeless Cell Stain Package (Invitrogen) was used for dwell cell gating (dilution 1:5,000). Anti-camelid VHH antibody (clone 96A3F5, GenScript) was used for detecting aVHH expression. Stream cytometry staining panels and gating methods are proven in Supplementary Figs. 8 and 9. All remaining cells had been aliquoted into 10 million cells and cryopreserved in CryoStor CS10 (StemCell Applied sciences). In all instances, cryopreserved samples from the respective uninjected management animals had been used as gating controls.
Rhesus cytokine evaluation
Rhesus monkey sera had been despatched to IDEXX BioAnalytics and examined on the Milliplex MAP Non-Human Primate Cytokine Magnetic Bead Panel (Millipore, cat. no. PCYTMG-40K-PX23) based on the producer’s protocol. Information had been collected by xPONENT 4.3 (Luminex), and information evaluation was accomplished utilizing BELYSA 1.1.0 software program. The information collected by the instrument software program are expressed as median fluorescence depth. Analyte requirements, qc and pattern median fluorescence depth values had been adjusted for background. Calibrator information had been match to both a five-parameter logistic or four-parameter logistic mannequin relying on greatest match to supply correct customary curves for every analyte. High quality management and pattern information had been interpolated from the usual curves after which adjusted based on dilution issue to supply calculated last concentrations of every analyte current within the pattern. Certified assay ranges are offered in Supplementary Desk 1.
Barcode counts
For FACS-sorted aVHH+ cells from mice and NHPs, DNA barcodes had been remoted by QuickExtract DNA Extraction Resolution (Lucigen) following the producer’s protocol. The samples had been then amplified utilizing KAPA HiFi HotStart Prepared Combine (Roche), following the producer’s protocol. Subsequent-generation sequencing runs had been carried out utilizing multiplexed runs on Illumina MiniSeq23,60. Briefly, the outcomes had been processed utilizing a customized Python-based instrument to extract uncooked barcode counts for every cell sort. These uncooked counts had been then normalized utilizing R earlier than additional evaluation. Counts for every particle had been normalized to the barcoded LNP combination injected into mice.
Single-cell multiomics preparation
The BD Rhapsody Single Cell Evaluation System was used for single-cell multiomics. Single-cell suspensions had been stained with oligo-tagged anti-camelid VHH antibodies (5′-CCTTGGCACCCGAGAATTCCAAAGTATGCCCTACGABAAAAAAAAAAAAAAAAAAAAAAAAAAAA*A*A-3′ chemically conjugated to MonoRab rabbit anti-camelid VHH antibody, mAb, GenScript; the asterisks denote phosphorothioate bonds). The ultimate focus was 0.5 mg ml−1 by protein weight. The dilution for staining was 1:2,000. After washing the labeled cells twice with PBS, the cell viability and numbers had been recorded for every pattern. The cells had been then pooled on the identical ratio, and a BD Rhapsody cartridge was loaded with 60,000 cells. cDNA libraries had been ready utilizing the BD Rhapsody Entire Transcriptome Evaluation Amplification Package following the BD Rhapsody System mRNA Entire Transcriptome Evaluation and Pattern Tag Library Preparation protocol (BD Biosciences). The ultimate libraries had been quantified utilizing a Qubit fluorometer and despatched to Novogene for sequencing. After the evaluation of library high quality utilizing Bioanalyzer (Agilent), sequencing was carried out by Illumina NovaSeq X Plus PE150 at Novogene.
Processing of single-cell multiomics sequencing information
The information had been processed utilizing STARsolo (v2.7.9a)61 in R (v4.3.1). All samples had been mapped to rheMac10, and solely exonic areas had been counted. All output recordsdata had been loaded into Seurat (v5.0.1). World-scaling normalization was used for the aVHH expression assay in a Seurat object. The method normalizes the function expression measurements for every cell by the overall expression, multiplies this by a scale issue 10,000 and log-transforms the end result. DoubletFinder (v3) was used to determine doublets62. This was adopted by principal element evaluation dimensional discount and UMAP clustering. aVHH oligo-tag counts had been mixed with RNA counts in Seurat and handled equally to different multimodal datasets comparable to mobile indexing of transcriptomes and epitopes by sequencing (CITE-seq)63. Visualization of gene and aVHH expression ranges was carried out utilizing R/Seurat instructions (FeaturePlot and DotPlot). For the mixing of a number of Seurat objects, Concord algorithm (v.1.2.1) was used. For UMAP illustration in Fig. 3a,d,g, cell clusters had been manually annotated in Seurat with marker genes listed in Supplementary Figs. 16–18.
Statistics and reproducibility
A minimal of three organic replicates had been analyzed for quantification, apart from untreated rhesus monkeys (N = 1). For the consultant cryo-TEM picture (Fig. 1i), 4 wide-field pictures and a minimum of ten high-magnification pictures (×40,000) had been collected from one batch of LNP pool with a consultant dimension distribution. All information are offered because the imply ± customary deviation or customary error of imply. Statistical evaluation between teams was carried out utilizing GraphPad Prism (variations 9.5 and 10). For information with a number of teams, the statistically important variations had been assessed utilizing two-way evaluation of variance with Tukey’s multiple-comparison check. For comparisons between two teams, unpaired two-tailed Scholar’s t-tests had been used. The pattern sizes (organic replicates), particular statistical assessments and predominant results of our statistical analyses for every experiment are detailed in every determine legend. A P worth of lower than 0.05 was thought of important.
Reporting abstract
Additional info on analysis design is out there within the Nature Portfolio Reporting Abstract linked to this text.